₹1,500 Discount on Combo Course
Grab Now Apply "FLAG26"
How to Generate P&L, Balance Sheet, Cash Flow and Ratio Analysis in TallyPrime in One Report Suite
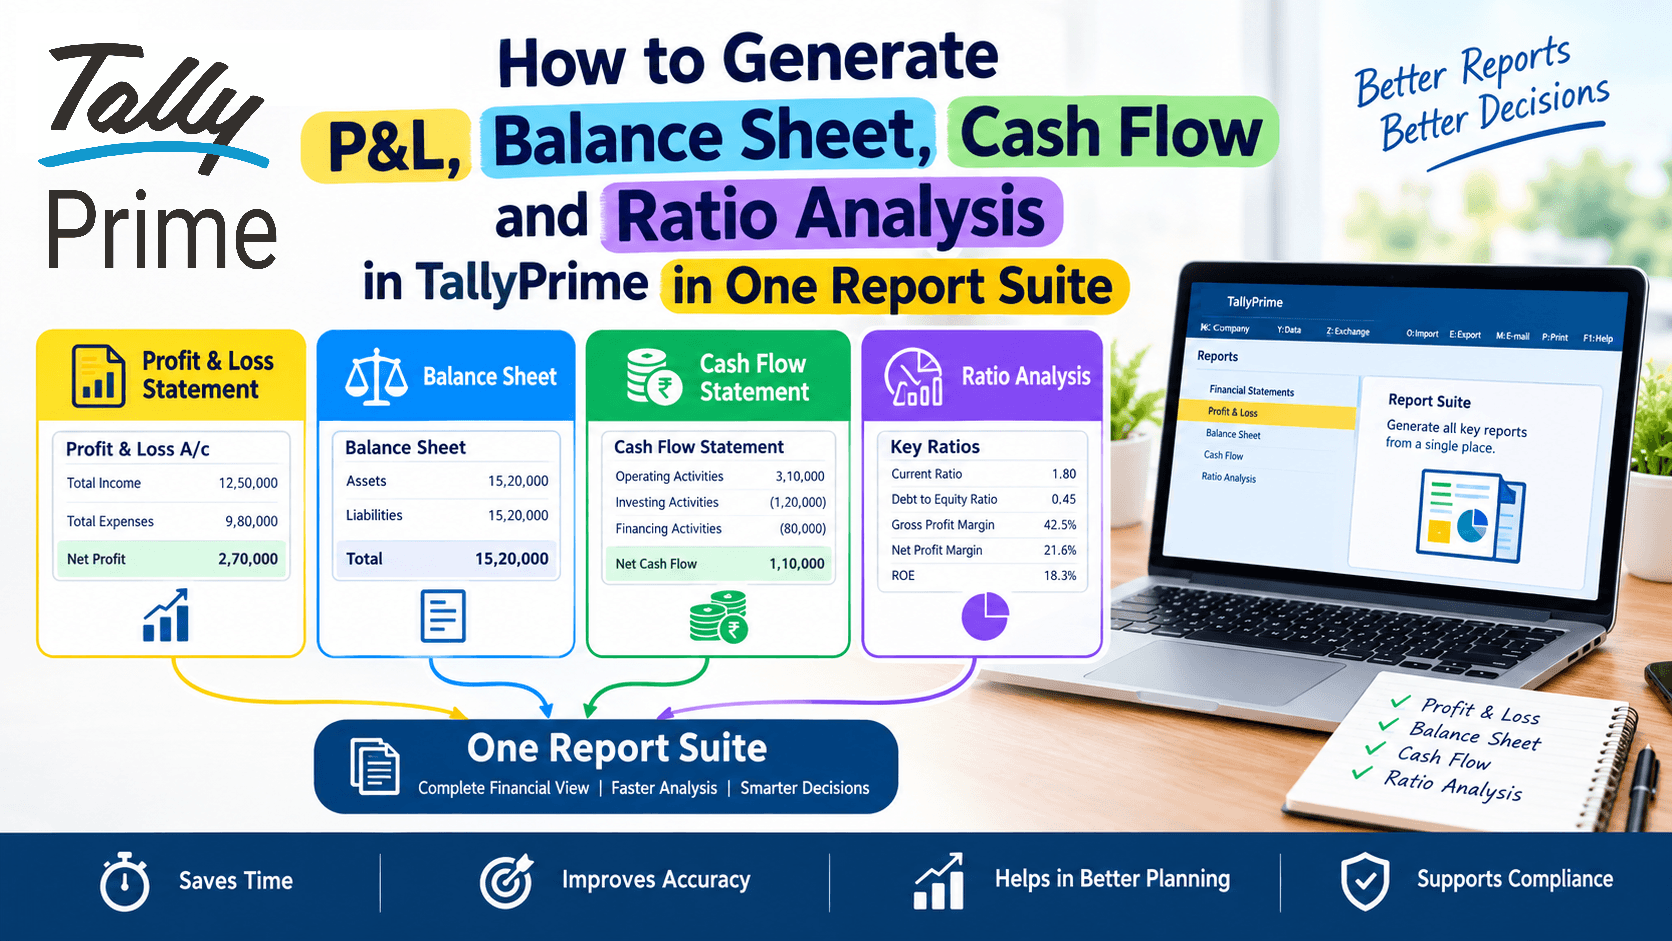
TL;DR
Struggling to switch between multiple tabs just to check your Profit & Loss, Balance Sheet, Cash Flow, and financial ratios? A growing business owner, hunting through different screens wastes valuable time. TallyPrime allows you to pull all these crucial financial statements and health checks into one unified report suite, helping you make fast, confident decisions without the accounting headache.
Introduction
Running a business is already demanding enough without having to play hide-and-seek with your own financial data. I’ve seen countless entrepreneurs open one screen for their Profit & Loss, close it to check the Balance Sheet, and then hunt somewhere else for cash flow or financial ratios. It gets exhausting.
What if you could see the big financial picture in a single place?
In my practice working with business owners and accountants, I’ve found that the secret to staying on top of your finances isn’t working harder—it’s knowing how to use TallyPrime’s built-in reporting features to bring everything together into one unified suite. Let’s look at how you can do this effortlessly.
Why Do Business Owners Struggle with Scattered Financial Reports?
When your financial numbers are scattered across different menus, you lose precious time. You might spot a healthy profit in your P&L, but you won't immediately know if your cash flow can support next month's inventory purchase.
When reports live in separate silos, you miss the hidden story behind your numbers. Business health isn't just about how much you earn; it’s about how your assets, liabilities, cash reserves, and efficiency ratios tie together at any given moment.
Can You Really View Your Entire Financial Health in One Suite?
Yes, absolutely. TallyPrime features powerful comparative and multi-statement views that let you bridge the gap between your core financial statements.
Instead of treating your P&L, Balance Sheet, Cash Flow, and Ratios as strangers, you can access and navigate them fluidly. By leveraging TallyPrime's flexible reporting layouts and browser-friendly views, you can pin or place key summaries side-by-side or drill down seamlessly from a high-level ratio straight into the underlying transaction.
How to Generate P&L, Balance Sheet, Cash Flow, and Ratio Analysis?
To access any of these core financial reports, follow these steps from the main menu:
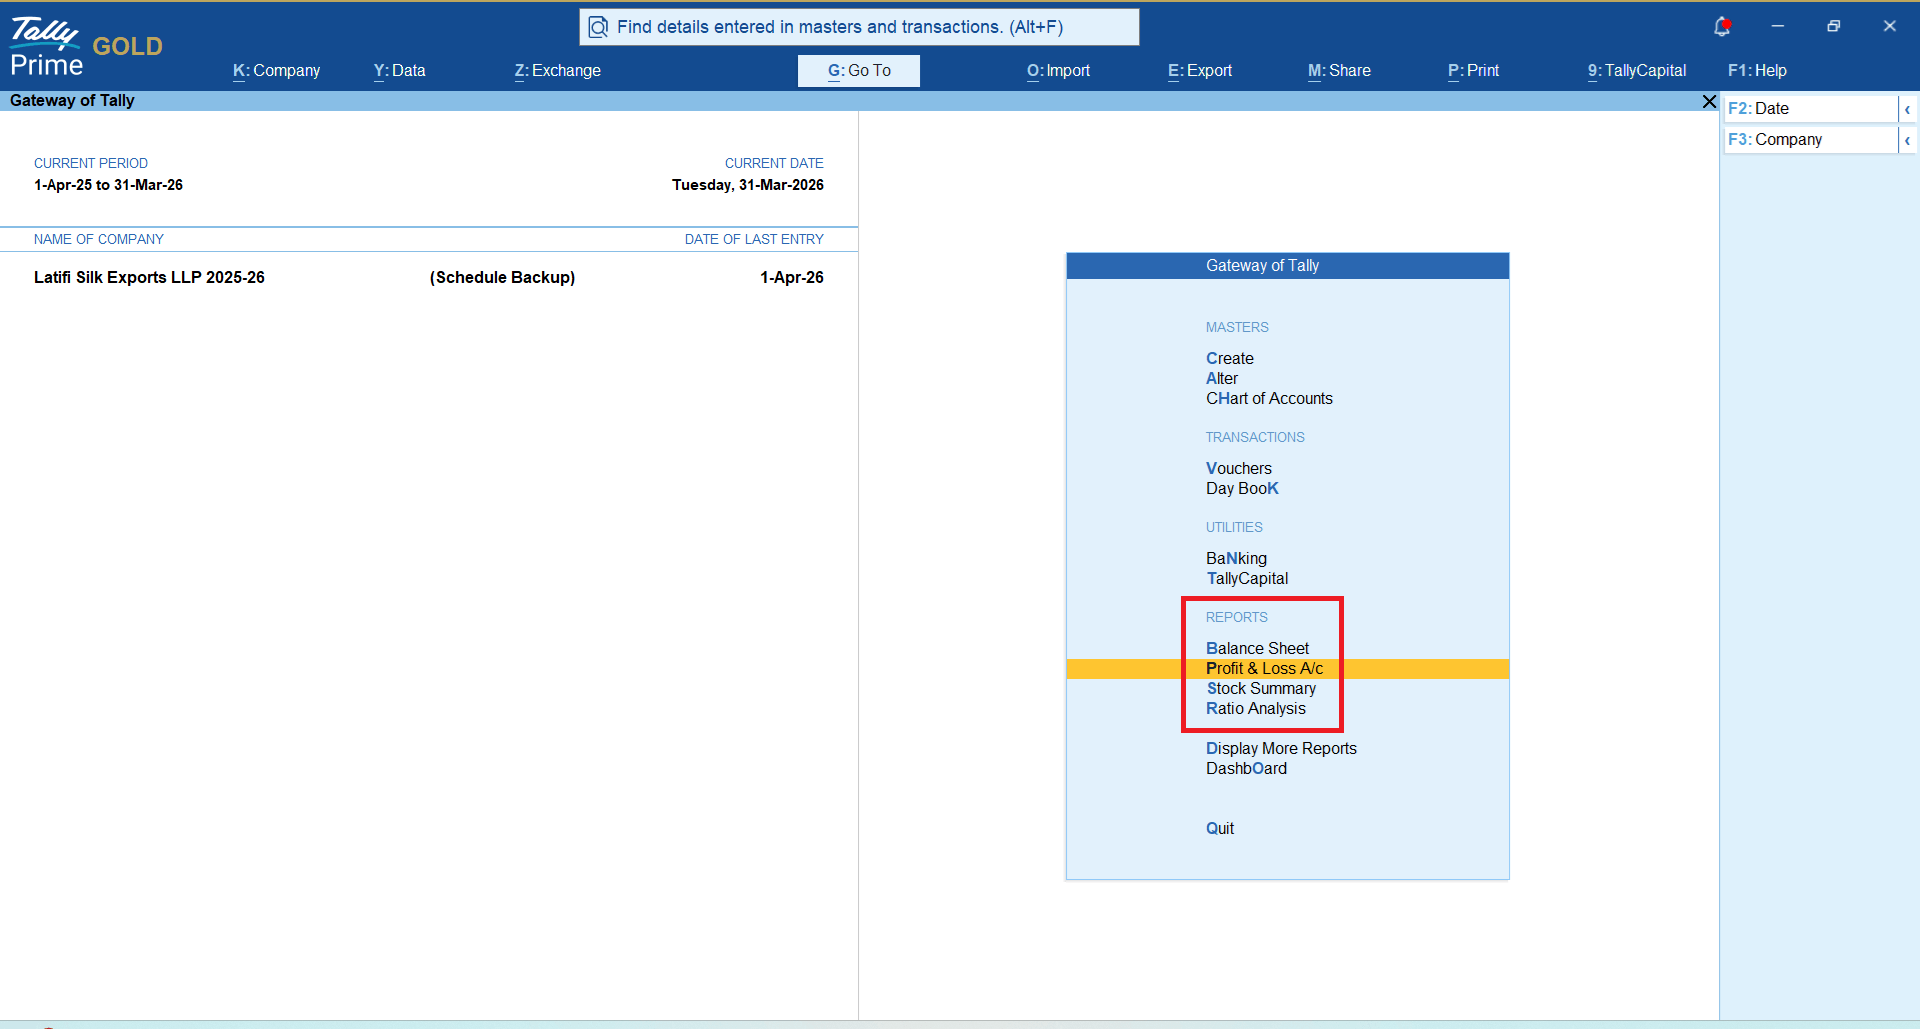
1.Go to Gateway of Tally:
From the main Gateway of Tally screen, use your arrow keys or mouse to select Profit & Loss A/c, Balance Sheet, and/or Ratio Analysis directly under the Reports menu.Verification: You will see the main summary screen for the selected report load on your display.
2.Accessing Cash Flow Statement:
For the Cash Flow Statement, go to Gateway of Tally > Display More Reports > Cash/Funds Flow > Cash Flow.
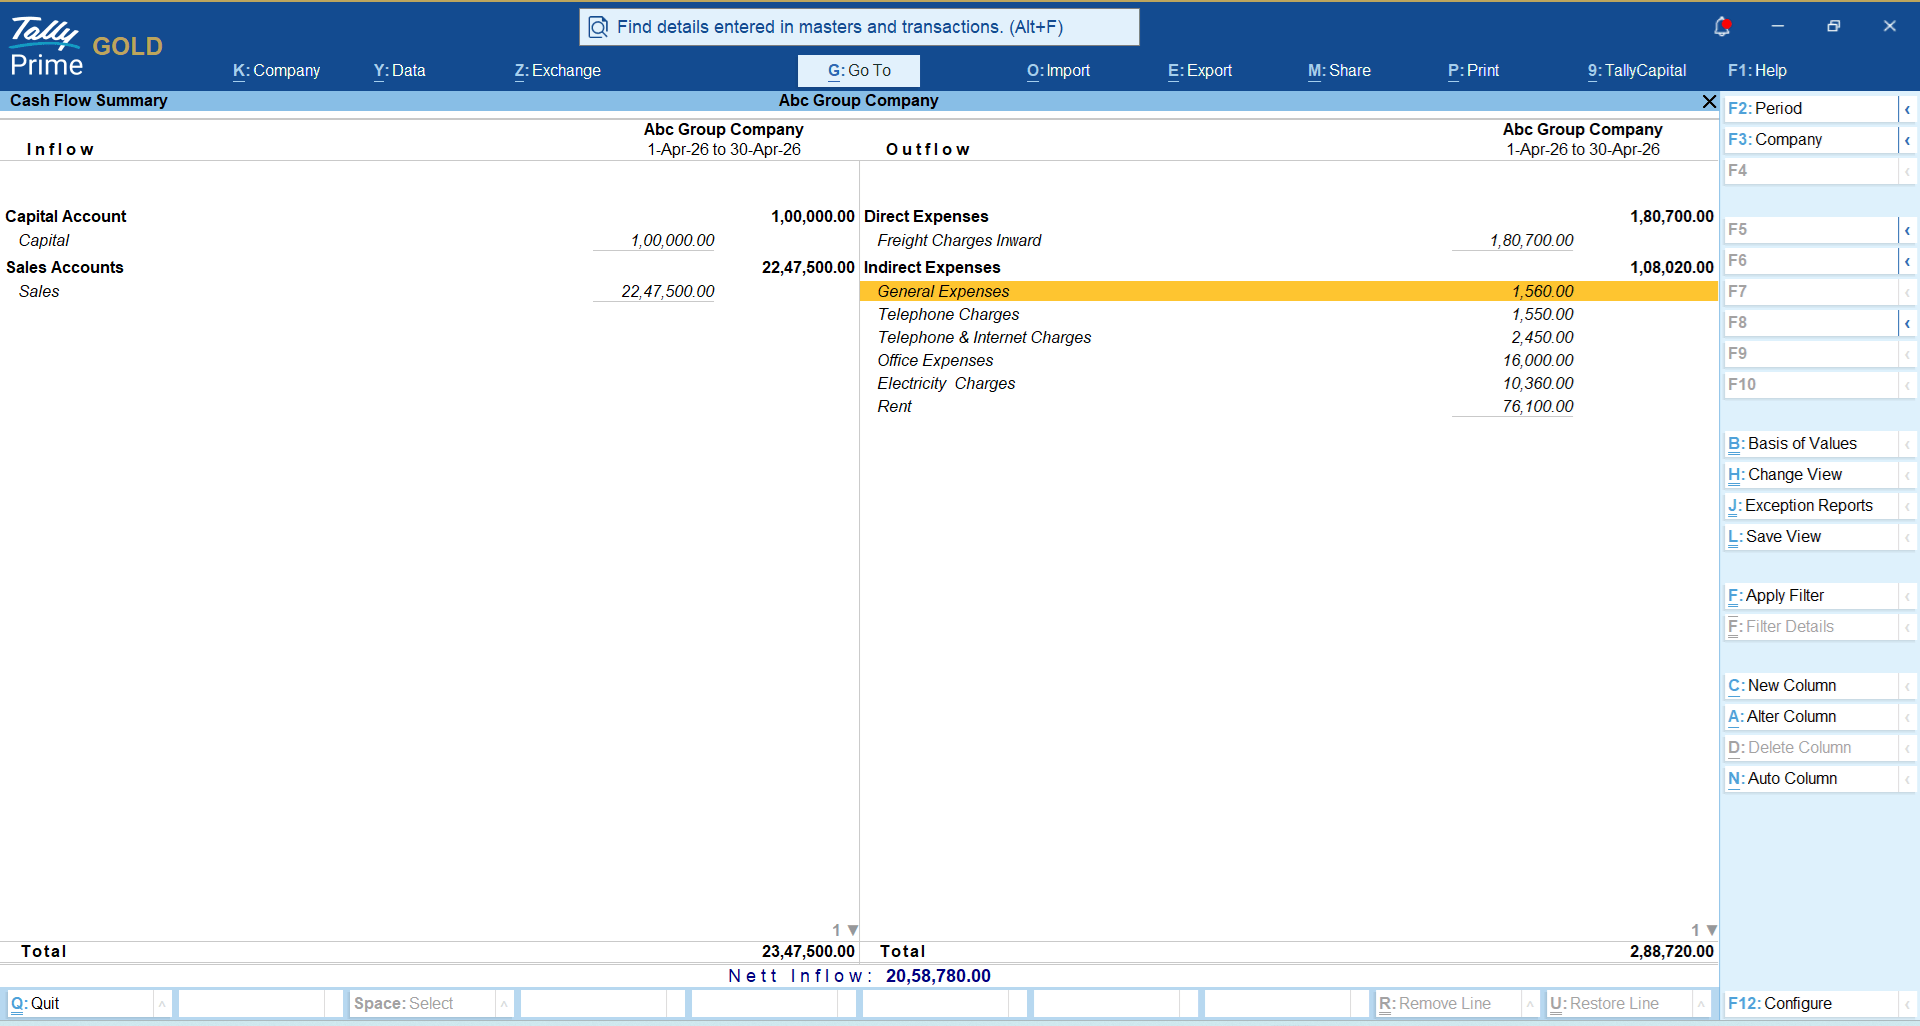
Verification: The Cash Flow summary displaying inflows and outflows across months or specific periods will appear.
3.Accessing Ratio Analysis:
From Gateway of Tally, select Ratio Analysis directly. This provides a live dashboard of key ratios (Working Capital, Quick Ratio, Debt/Equity, etc.).
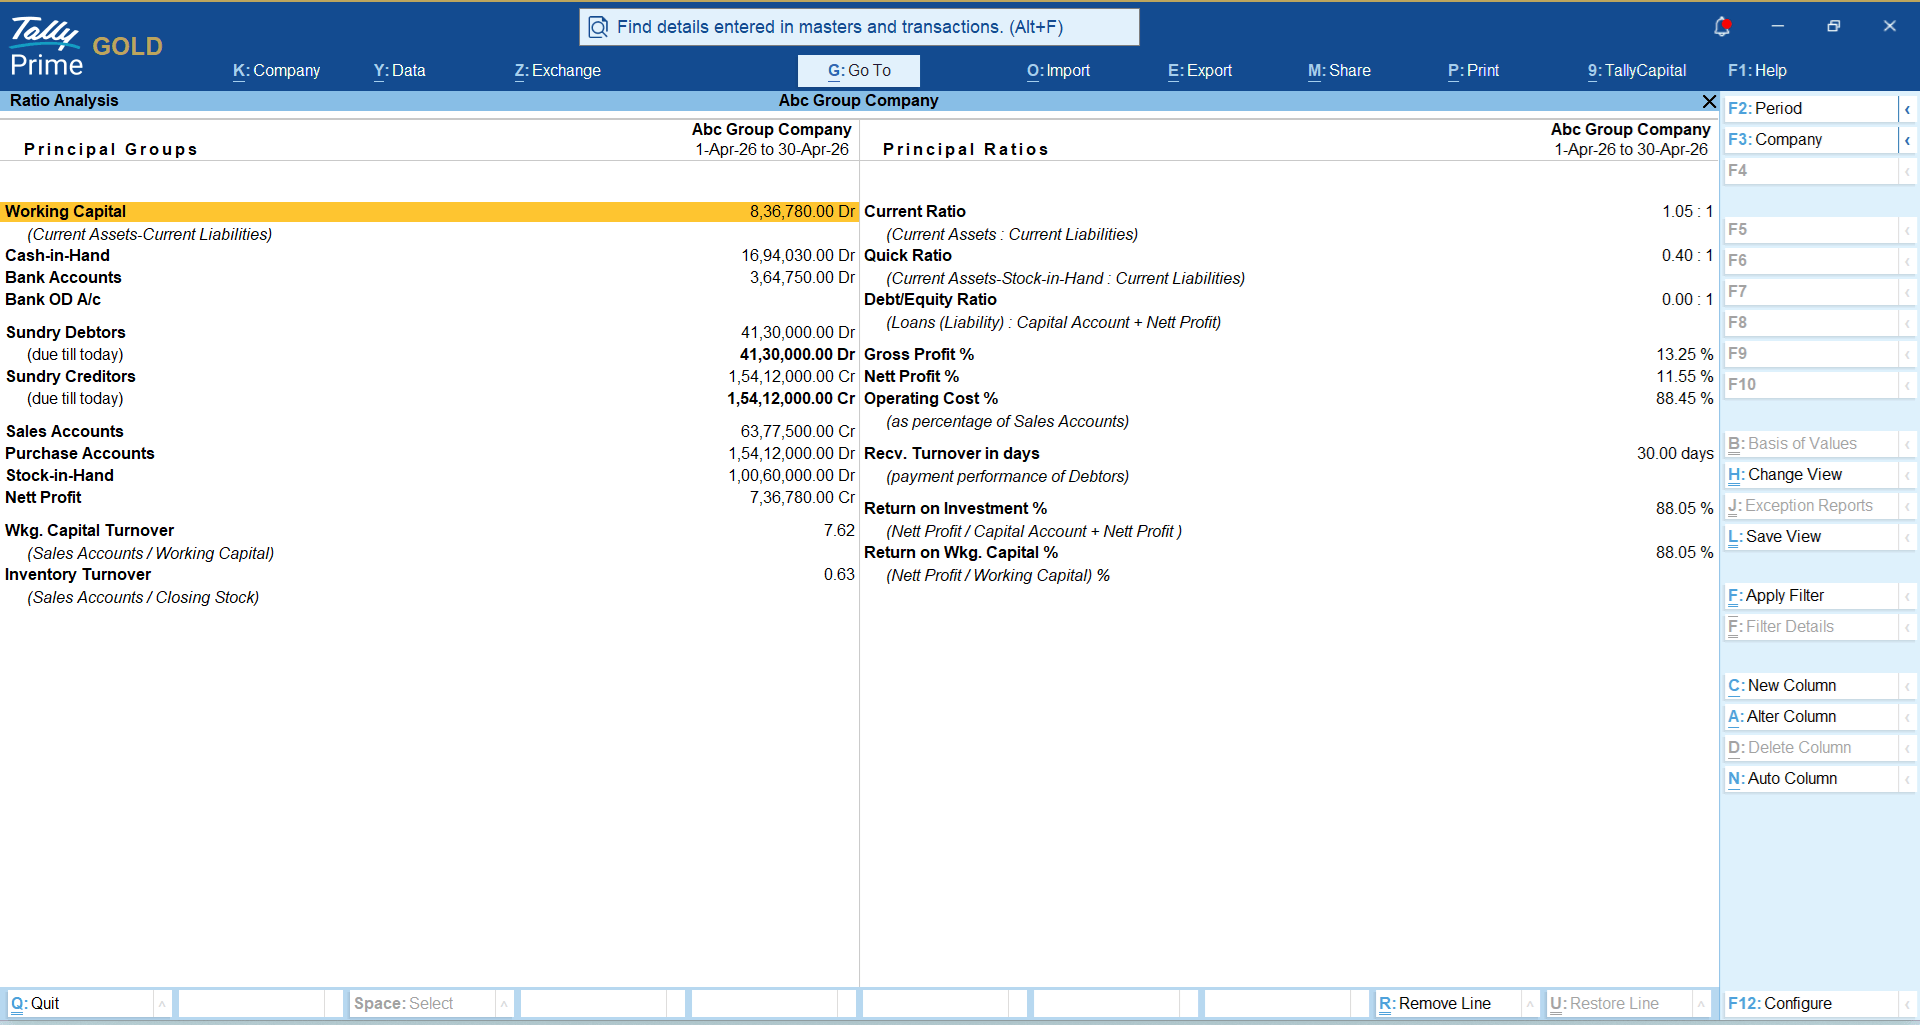
Verification: A consolidated list of financial ratios calculated dynamically from your vouchers will be displayed.
2. How to Customize Reports and Dashboards in TallyPrime
TallyPrime offers powerful customization features on the right-hand button bar (or via keyboard shortcuts) to change periods, view detailed breakdowns, or filter data.
A. Common Customization Options (Applicable to P&L, Balance Sheet, and Cash Flow)
- Change Period (F2): Press F2 to specify a custom date range (e.g., specific quarters, months, or financial years). Verification: The report header updates to reflect your chosen date range.
- Detailed View (Alt + F1): Press Alt + F1 (or click Detailed) to expand summarized groups into ledger-level details. Verification: Sub-ledgers and individual accounts under primary groups become visible.
- Columnar View (F6): Columnar View (F6): Press F6 to compare periods side-by-side (e.g., comparing Month-on-Month or Quarter-on-Quarter performance). Verification: Additional columns appear showing data categorized by the chosen time intervals.
- Basis of Values (Ctrl + B): Press Ctrl + B to change how values are treated—such as showing inventory valuation methods (FIFO, Average Cost, etc.) or including/excluding optional vouchers.
B. Customizing the TallyPrime Dashboard
TallyPrime features an interactive Dashboard capability that lets you pin reports and tile metrics directly onto your home screen:
- From any report (like your Balance Sheet or Ratio Analysis), press Alt + M (Save View) or use the Dashboard option if available in your release version.
- To add tiles to your Dashboard, navigate to Go To (Alt + G) or Dashboard, and select Add Tile.
- Choose the specific report metric you want to monitor (e.g., Cash-in-Hand, Quick Ratio, Net Profit, or Outstanding Receivables).
- Configure/Resize Tiles: Use the configuration options to change the tile layout, rearrange blocks, or filter specific periods so your custom dashboard shows only the metrics you care about most upon startup. Verification: Your newly added tiles appear instantly on your startup Dashboard screen and update in real-time as new vouchers are passed.
How does TallyPrime build reports and update in real time as transactions are posted?
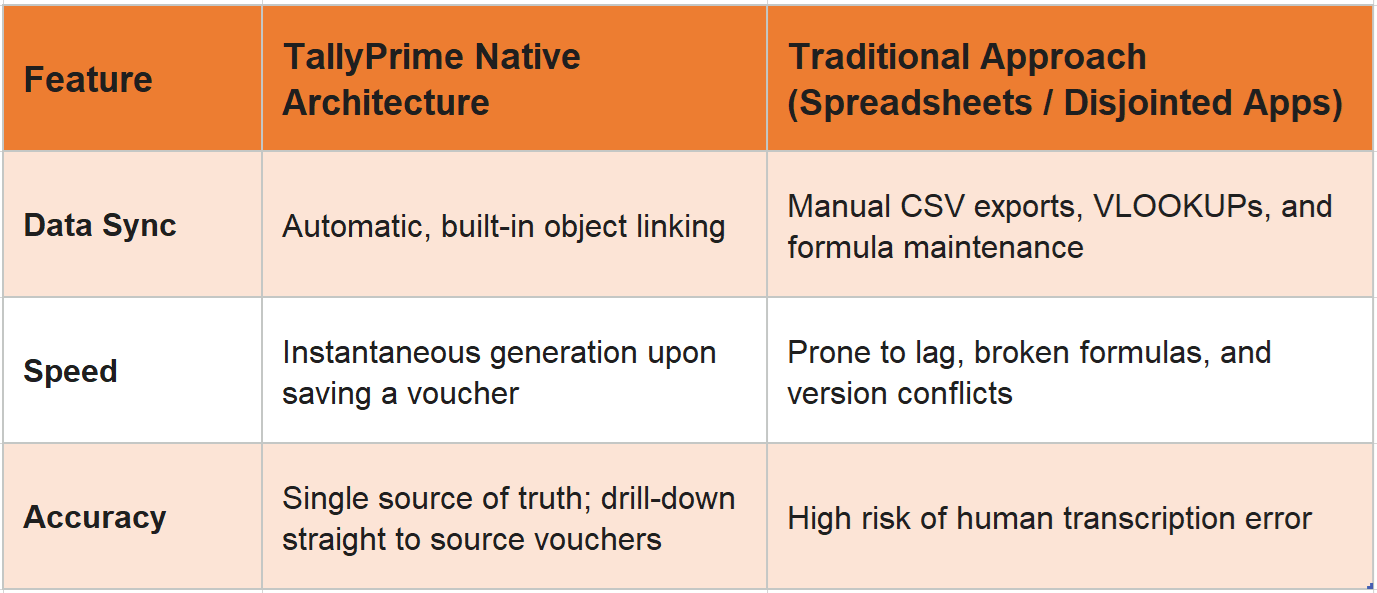
To understand how TallyPrime generates reports and updates them in real time without external databases or spreadsheets, we have to look under the hood at its architecture.Unlike many software applications that treat data entry and reporting as separate entities—requiring synchronization tools or background data sync jobs—TallyPrime is built on an integrated engine.
1. The Core Architecture: Object-Oriented Database
At its heart, TallyPrime uses a proprietary, purpose-built object-oriented database structure rather than a traditional relational database (like standard SQL setups) for its day-to-day transaction storage.
- Every master (such as a customer ledger, stock item, or tax head) and every voucher (such as a sales invoice, payment receipt, or journal entry) is stored as an independent object containing its own attributes and relationships.
- Because data is modeled as interconnected objects, there are no separate tables that need to be manually joined, queried, or exported via middleware.
2. Real-Time Processing: The Moment You Press "Save"
When an accountant or business owner enters a transaction and hits Accept/Save, a cascade of actions happens instantaneously:
- Immediate Ledger Impact: The voucher object updates the ledger accounts involved (e.g., reducing stock, increasing accounts receivable, and registering revenue).
- Zero-Lag Calculation Engine: Because financial summaries (like P&L and Balance Sheet groupings) are dynamically derived from active object states rather than pre-calculated static tables, there is no batch processing or overnight "closing" required.
- Instantaneous Ratio Computations: The second a transaction touches a ledger, metrics like the Current Ratio or Working Capital are re-computed because their underlying data source has shifted.
Summary of Benefits
How Do You Set Up This Unified View in TallyPrime?
Getting everything into one streamlined workflow doesn't require complex coding or custom add-ons. Here is the simple approach I recommend to my clients:
- Start with the Financial Reports Menu: Navigate to your Gateway of Tally and open your Balance Sheet or Profit & Loss Account.
- Leverage the 'Basis of Values' and 'Change View' Options: Use the right-hand button bar in TallyPrime to switch perspectives. You can instantly view your statements horizontally, bring in closing stock details, or toggle to comparative periods.
- Integrate Ratio Analysis: Keep your Ratio Analysis screen pinned or accessible right alongside your main statements. It acts like a dashboard gauge—showing you quick indicators like your current ratio, quick ratio, and working capital turnover without requiring manual math.
- Bring in Cash Flow: Access your Cash Flow summary to instantly see where your money came in and where it went, matching the timeline of your P&L performance.
"Financial clarity doesn't come from having more data; it comes from having the right data placed right in front of you when you need it."
Real-World Example: How Sharma Trading Co. Cleared Their Financial Fog
Take my client, Rajesh, who runs a mid-sized trading business in Bhagalpur. Every month-end, Rajesh used to spend hours toggling between his ledger reports, trying to figure out why his bank balance looked tight despite a seemingly good profit margin.
When I showed him how to configure his TallyPrime dashboard to review his P&L alongside his Cash Flow statement and key liquidity ratios in one connected session, everything changed. He immediately noticed that while sales looked great on paper, his receivables collection cycle was dragging down his cash flow. Armed with that single-screen insight, he tightened his credit terms the very next week, resolving a cash crunch before it became a crisis.
Frequently Asked Questions
1. Can I view my P&L and Balance Sheet on the same screen in TallyPrime?
Yes, TallyPrime allows you to configure your dashboard settings or use horizontal formats to analyze your core statements smoothly without losing your place.
2. Do I need special software customization to see financial ratios?
Not at all. Ratio Analysis is a built-in report in TallyPrime that updates automatically as you record your daily vouchers and transactions.
3. How does the Cash Flow statement connect to the P&L?
Your P&L shows revenue and expenses on an accrual basis, while the Cash Flow statement tracks actual cash movements, helping you see how operational profits translate into real cash.
4. Can I access these combined reports remotely?
Yes, if you use TallyPrime's connected features or browser-based access, you can securely view your financial summaries from anywhere on your laptop or mobile device.
5. How often should I review my financial ratios?
I recommend checking your key ratios at least once a month alongside your regular P&L and Balance Sheet review to catch trends early.
6. Is this setup suitable for small businesses?
Definitely. Even micro-businesses benefit immensely from seeing their financial statements together, as it saves time and prevents costly financial oversights.