How Can SMBs Create Customisable Financial Statements in TallyPrime and Get the Reports They Actually Need?
TL;DR
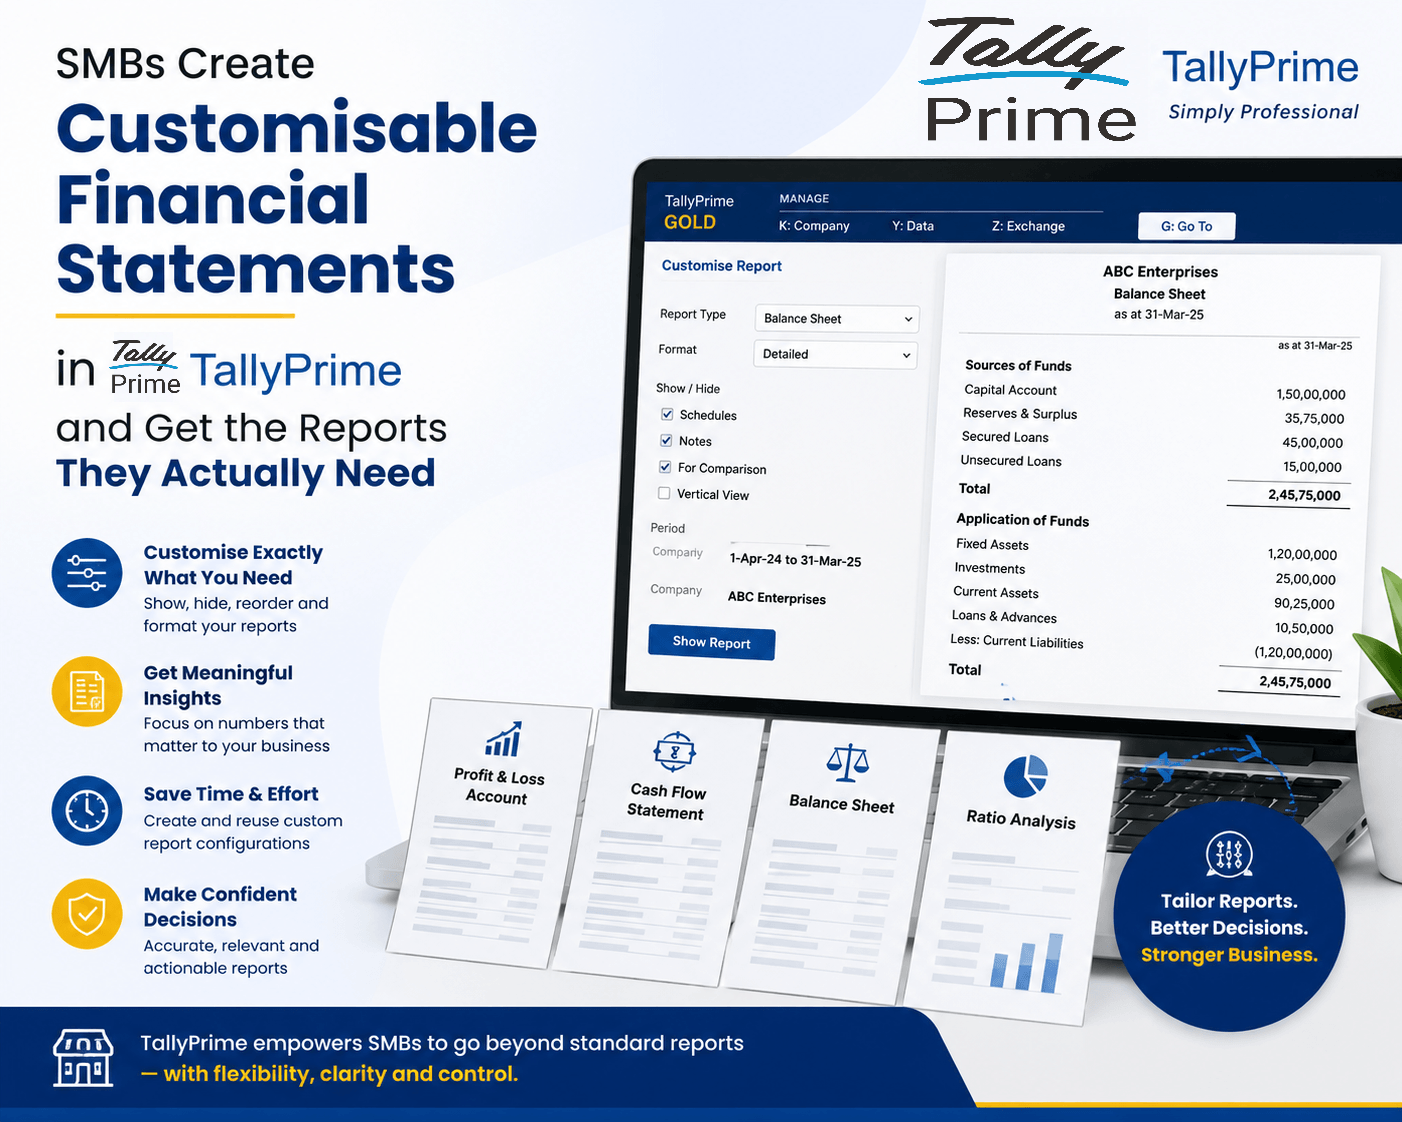
Small and Medium Businesses (SMBs) often struggle with rigid, one-size-fits-all financial reporting that fails to highlight their unique operational insights. TallyPrime solves this pain point by offering flexible, highly customizable financial statements—allowing users to easily alter views, apply multi-column comparisons, slice data via Cost Centres, and save personalized views. This flexibility enables business owners to move beyond basic data entry and instantly access data tailored to their specific strategic needs.
Introduction
Many small and medium businesses generate financial reports regularly, but often these reports do not answer the specific questions business owners want to ask. TallyPrime's Customisable Financial Statements help SMBs view financial data exactly the way they need it, making reports more practical, insightful, and decision-oriented.
Rajesh Kumar owned a growing wholesale distribution business. Every month, he received financial reports from his accounting software, but he was often frustrated. One day, Rajesh called me and said; "my Profit & Loss report shows overall profit, but I want to know which branch is performing better and where my expenses are increasing." I said; "That's exactly where TallyPrime's Customisable Financial Statements can help. Let's customize your reports according to your business needs."
I opened TallyPrime and configured Cost Centres for Rajesh's Patna and Bhagalpur branches. He then enabled columnar reporting to compare branch-wise sales and expenses.
Within minutes, Rajesh could see:
- Patna Branch Profit: ₹4,50,000
- Bhagalpur Branch Profit: ₹2,80,000
- Marketing Expenses increased by 20% this quarter
Rajesh said; "This is exactly the information I needed! Thanks to TallyPrime.

₹1,500 Discount on Combo Course
Grab Now Apply "FLAG26"
How Do Customisable Financial Statements in TallyPrime Help SMBs Get the Reports They Actually Need?
Standard financial statements tell you where your business stands legally, but they rarely tell you where your business is going operationally. For a growing small-to-medium business, relying on static, generic reports means missing the granular patterns that dictate cash flow and profitability.
TallyPrime addresses this gap directly by allowing businesses to dynamically customize Balance Sheets, Profit & Loss accounts, and cash flow reports on the fly without complex coding or external spreadsheets. By configuring layouts, comparing different time frames side-by-side, and saving specific dashboard views, SMB owners can instantly transform raw accounting records into tailored strategic insights.
Why Do One-Size-Fits-All Financial Reports Fail Growing SMBs?
Most standard accounting platforms generate rigid financial statements designed strictly for compliance. While an official auditor wants to see a high-level, consolidated view, an entrepreneur needs to know which specific store branch is draining cash or how this quarter’s inventory costs stack up against last year’s.
How Can You Alter Layouts and Detail Levels on the Fly?
TallyPrime gives you instant control over the depth of information displayed in your primary statements. With a couple of keyboard shortcuts, you can slice through dense data rows to find precisely what you are looking for.
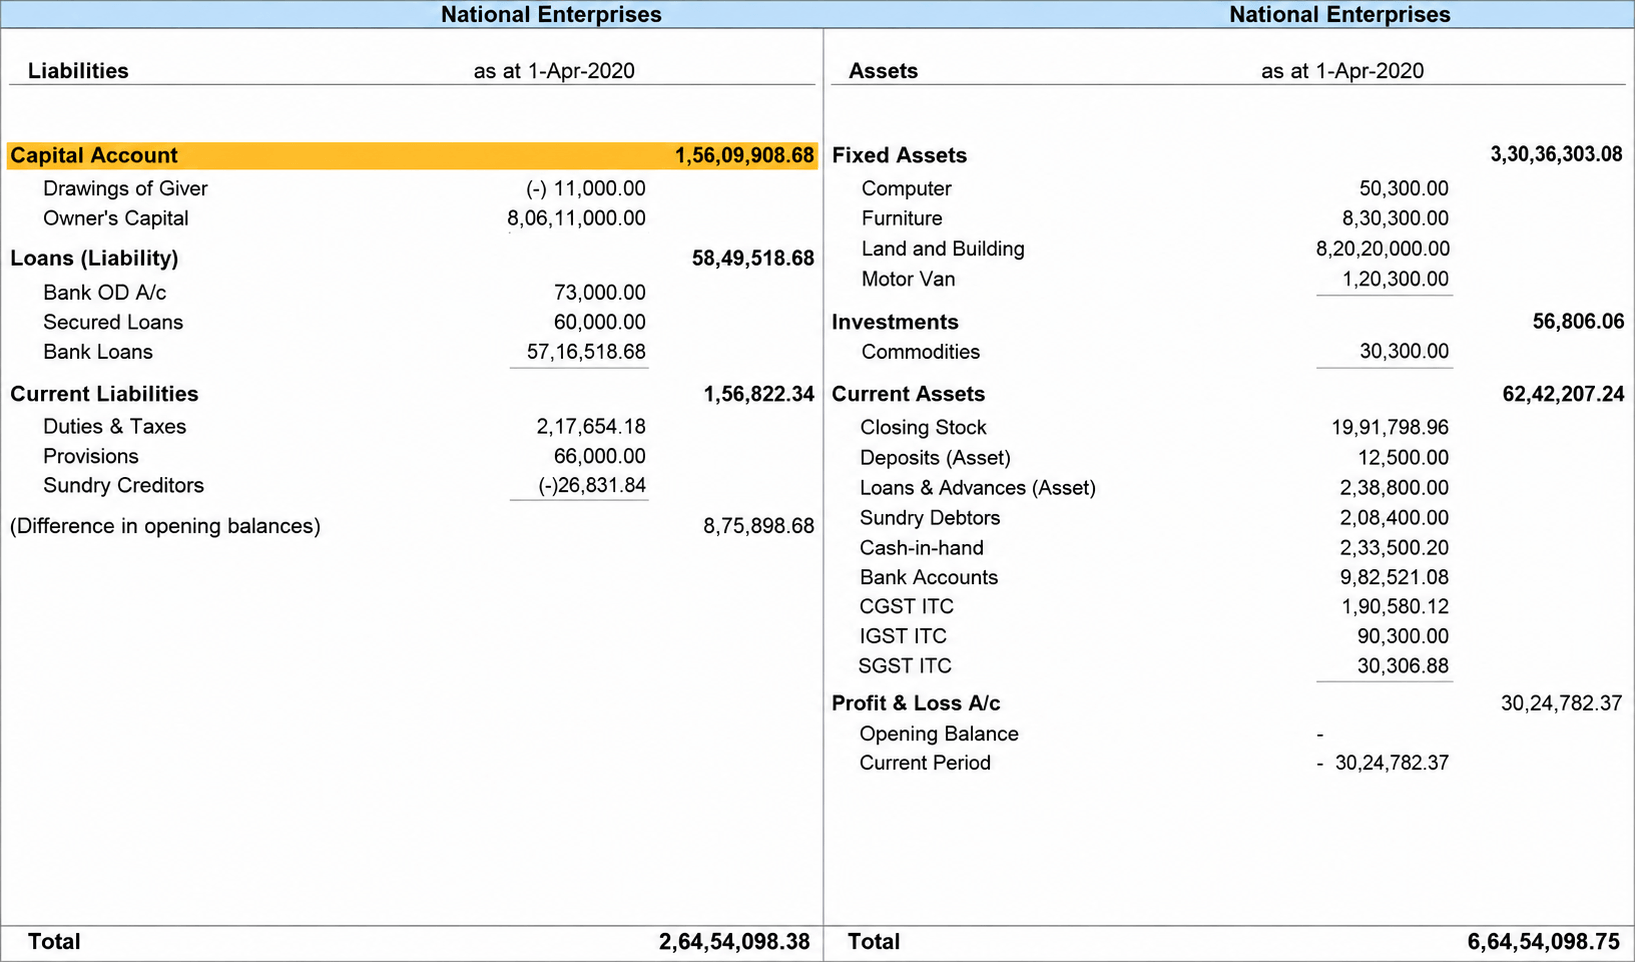
- Detailed vs. Condensed Views: Switch seamlessly between a condensed layout (great for a quick health check) and a detailed view (essential for tracing specific ledgers).
- The Power of Alt + F1: Pressing Alt + F1 or F12 (Configure) allows you to break down groups like "Current Assets" into their component ledgers—such as individual bank accounts or customer outstanding balances—right inside your Balance Sheet.
What Is the Easiest Way to Compare Financial Periods Side-by-Side?
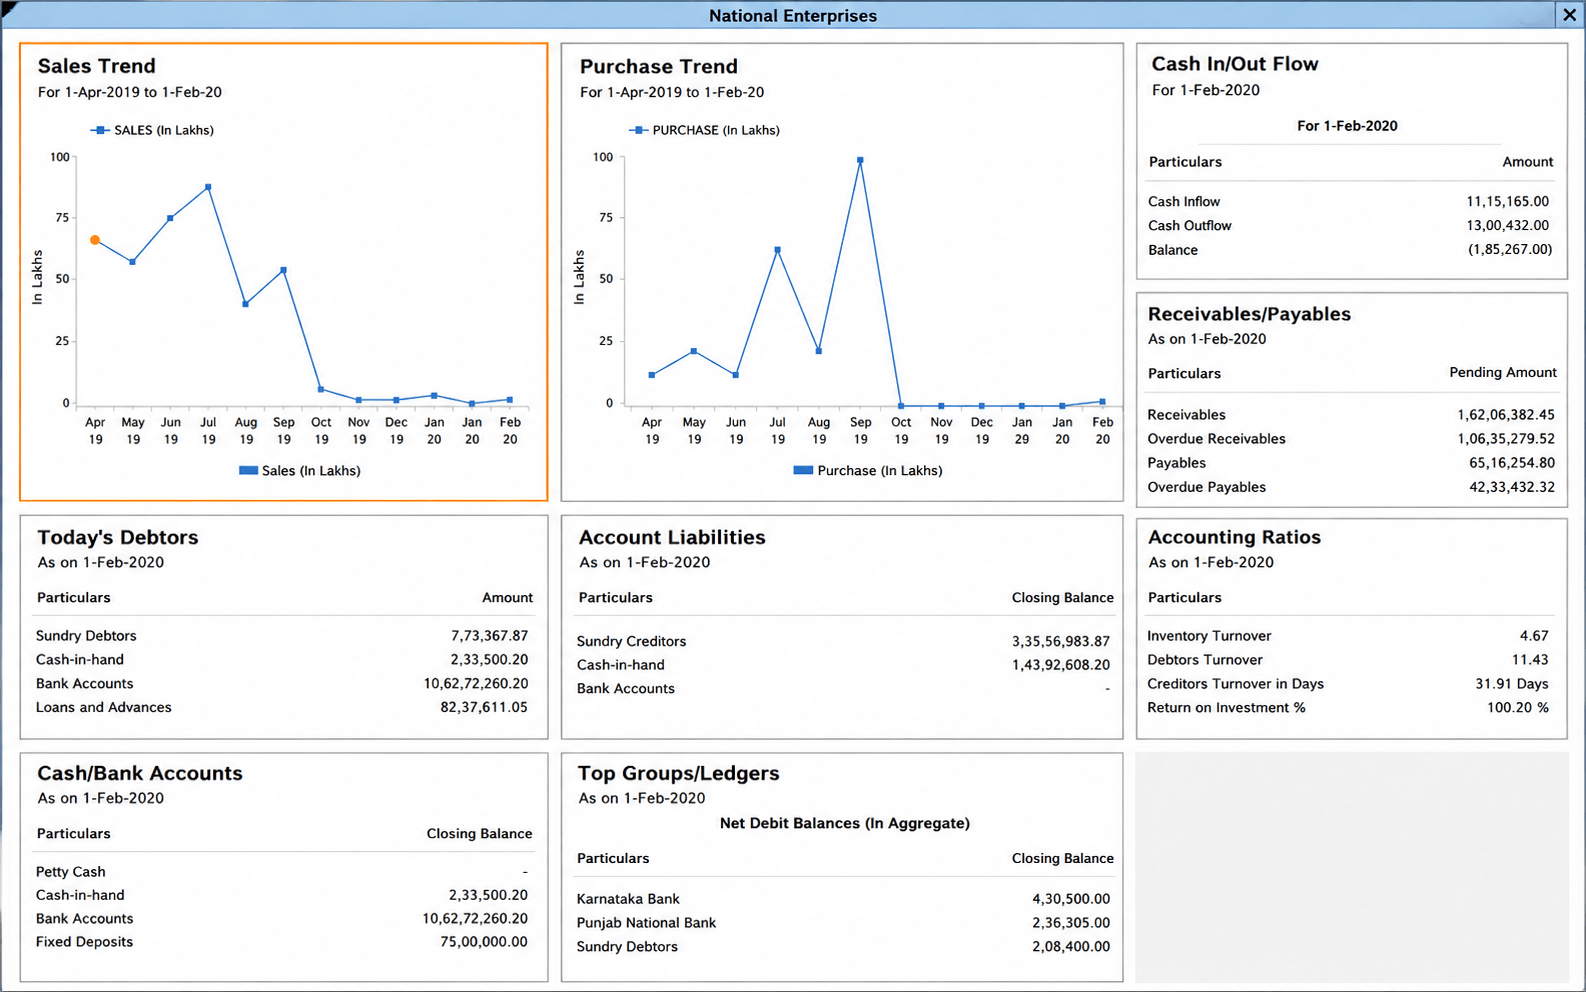
One of the biggest hurdles for business owners is understanding operational trends over time. TallyPrime solves this with its Multi-Column Reporting feature.
Instead of opening multiple windows or exporting reports to compare performance, you can use the Alt + C shortcut to add new columns to your active Profit & Loss statement or Balance Sheet. This allows you to view:
- Quarter-on-Quarter (QoQ) or Year-on-Year (YoY) changes side-by-side.
- Multi-currency comparisons if you handle international clients.
- Branch vs. Branch performance under a single consolidated company view.
Real-World Context:
Imagine you run a retail business with three outlets. By adding columns for each location side-by-side in your P&L statement, you can instantly pinpoint which branch has the highest overhead expenses relative to its sales revenue.
Segment Financial Performance Using Cost Centres
When a business expands, tracking profitability by company broad-strokes is no longer sufficient. TallyPrime's Cost Centre capability lets you allocate income and expenses to specific segments of your operations.
You can customize your financial reports to filter data by:
- Specific Projects: Ideal for construction, contracting, or consulting agencies to monitor job costings.
- Departments: Track the exact spending ROI of your marketing department versus your HR operations.
- Sales Executives: See exactly how much revenue an individual team member brings in compared to their travel and client acquisition costs.
How Does the "Save View" Feature Keep Your Custom Reports Handy?
Historically, customizing a report meant you had to re-apply your favorite filters, columns, and configurations every single time you reopened the software. TallyPrime eliminates this repetitive task with its Save View functionality.
Once you have arranged a financial statement exactly how you like it—for example, a monthly comparative cash flow analysis filtered for a specific region—you can save that specific configuration. You can name the view, choose whether to make it available to all users or just yourself, and access it with a single click in the future via the Go To search bar.
How to Export Reports from TallyPrime to Excel Without Additional BI Tools
One of the biggest advantages of TallyPrime is that you can export almost any report directly to Microsoft Excel without purchasing or integrating separate Business Intelligence (BI) tools. This helps SMBs analyze financial data, create custom reports, and share information with management quickly.
Steps to Export a Report to Excel in TallyPrime
Step 1: Open the Required Report
Navigate to the report you want to export, such as:
- Profit & Loss Account
- Balance Sheet
- Trial Balance
- Sales Register
- Purchase Register
- Outstanding Reports
- Stock Summary and more
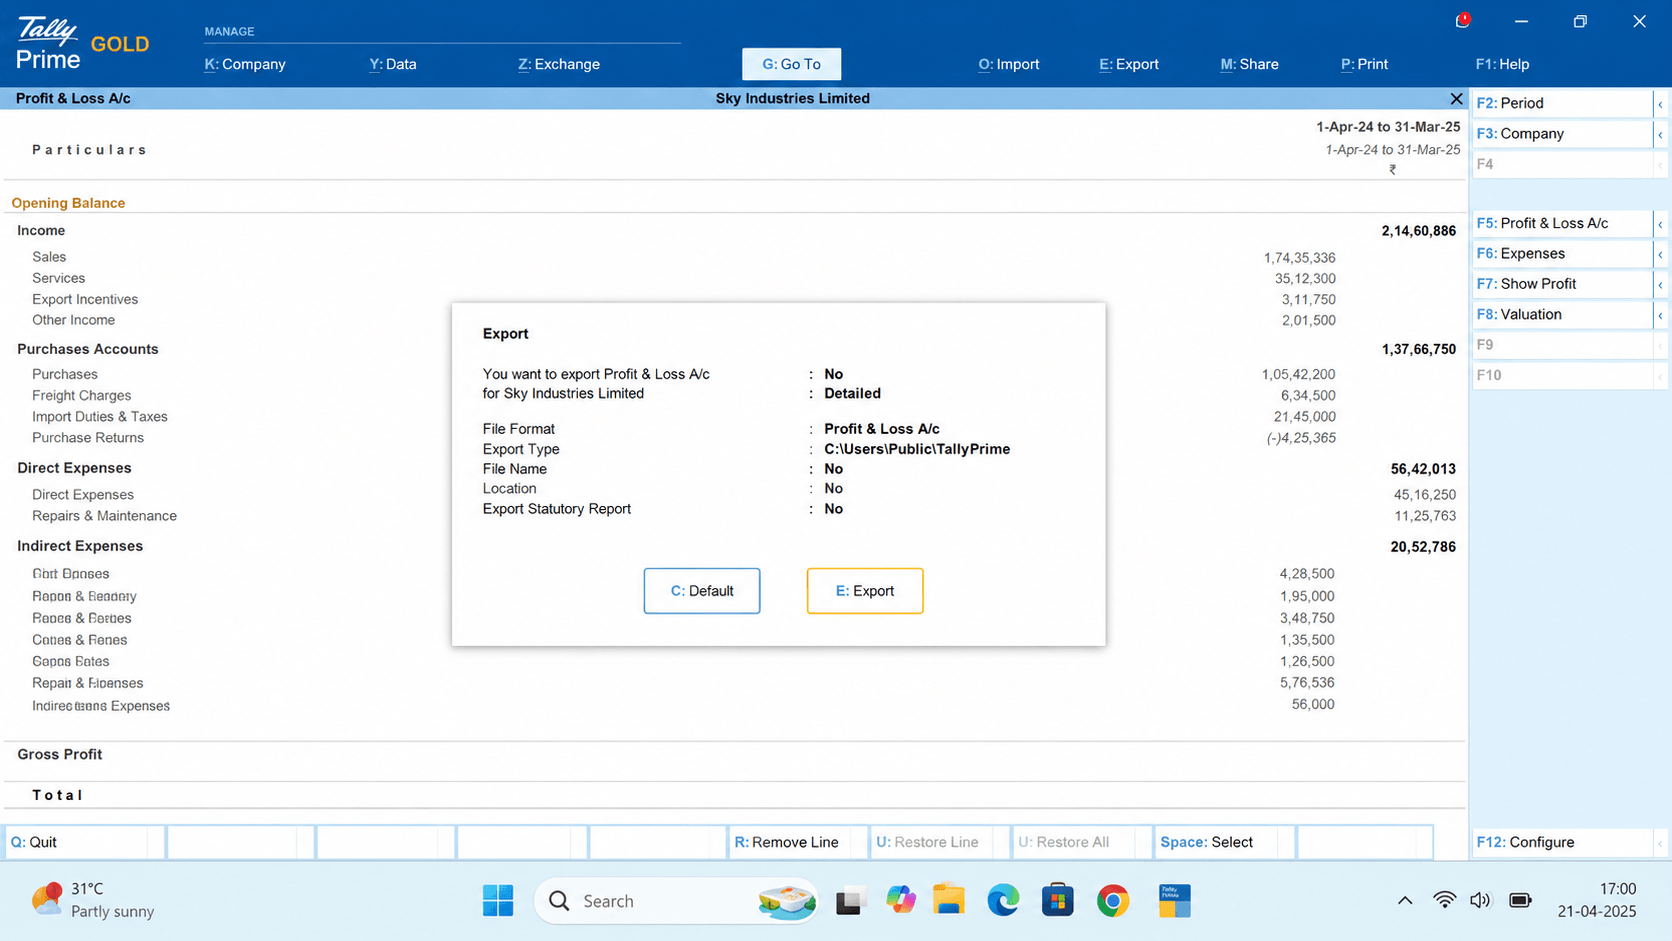
Step 2: Press Export
From the report screen:
Top Menu → Exportor
simply press Alt + E
Conclusion:
In my experience, SMBs rarely suffer from a lack of data. The real challenge is getting useful information from that data.
TallyPrime helps businesses move beyond standard accounting reports by allowing them to customize financial statements according to their operational needs. Combined with features like bank statement import and faster reconciliation, it enables business owners to spend less time gathering information and more time making decisions.
Quick Action Checklist
- Review your monthly Profit & Loss report
- Compare current and previous periods
- Use Cost Centres for branch or department tracking
- Filter reports instead of exporting everything to Excel
- Import bank statements directly into TallyPrime
- Reconcile accounts regularly
- Focus on decision-making, not just bookkeeping